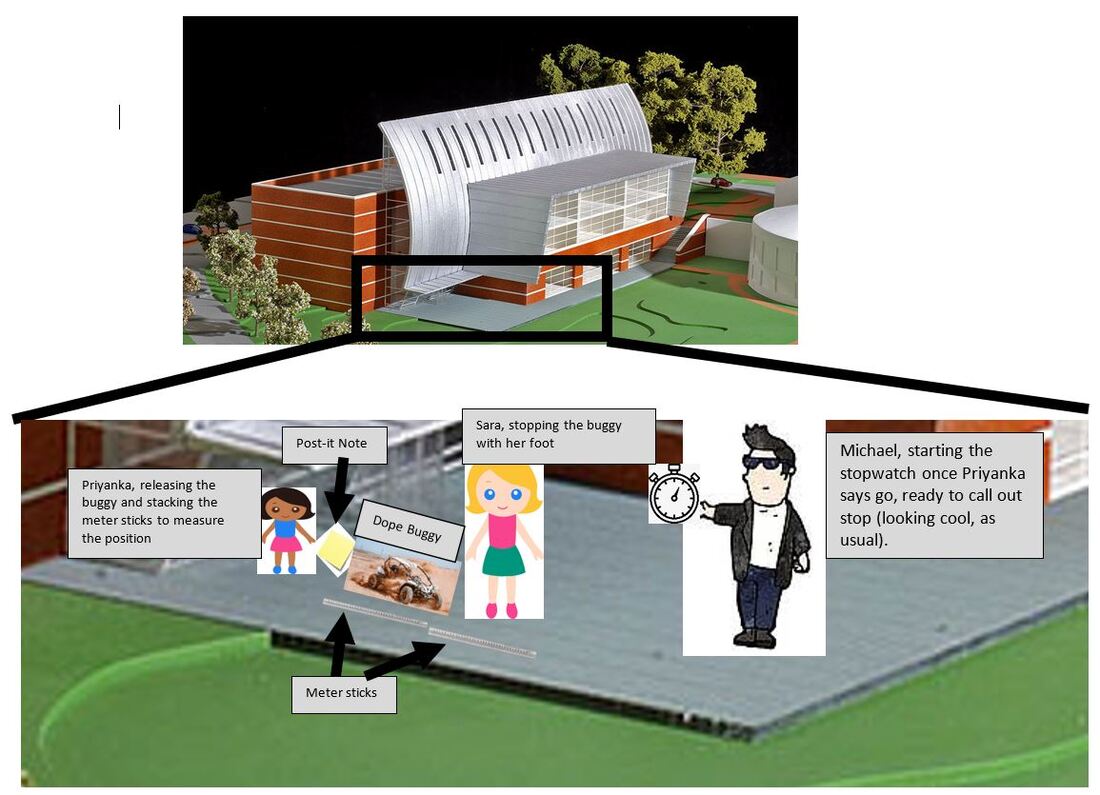
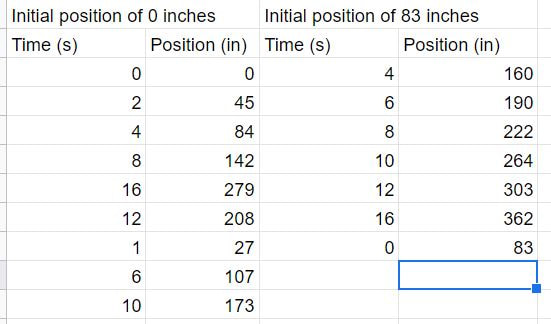
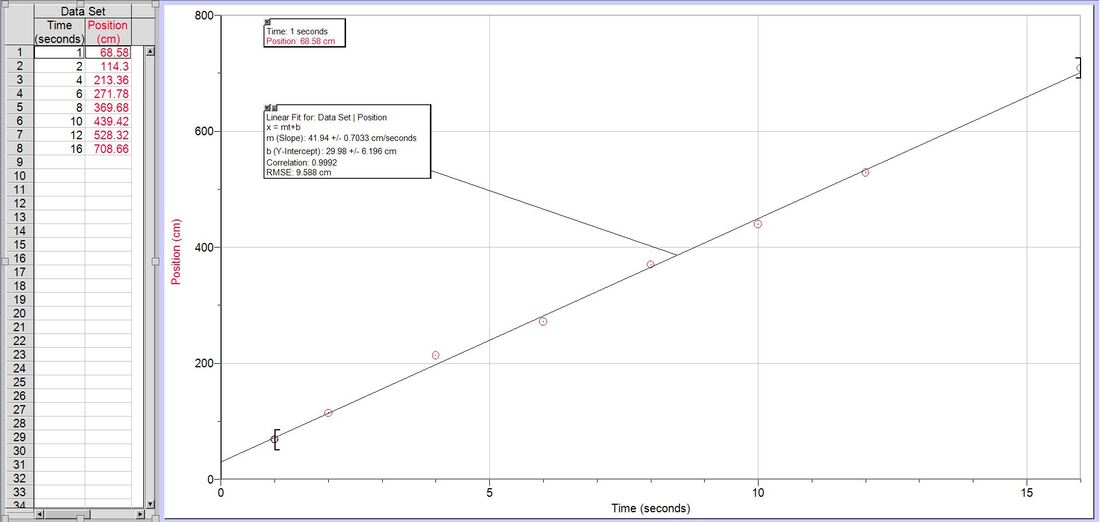
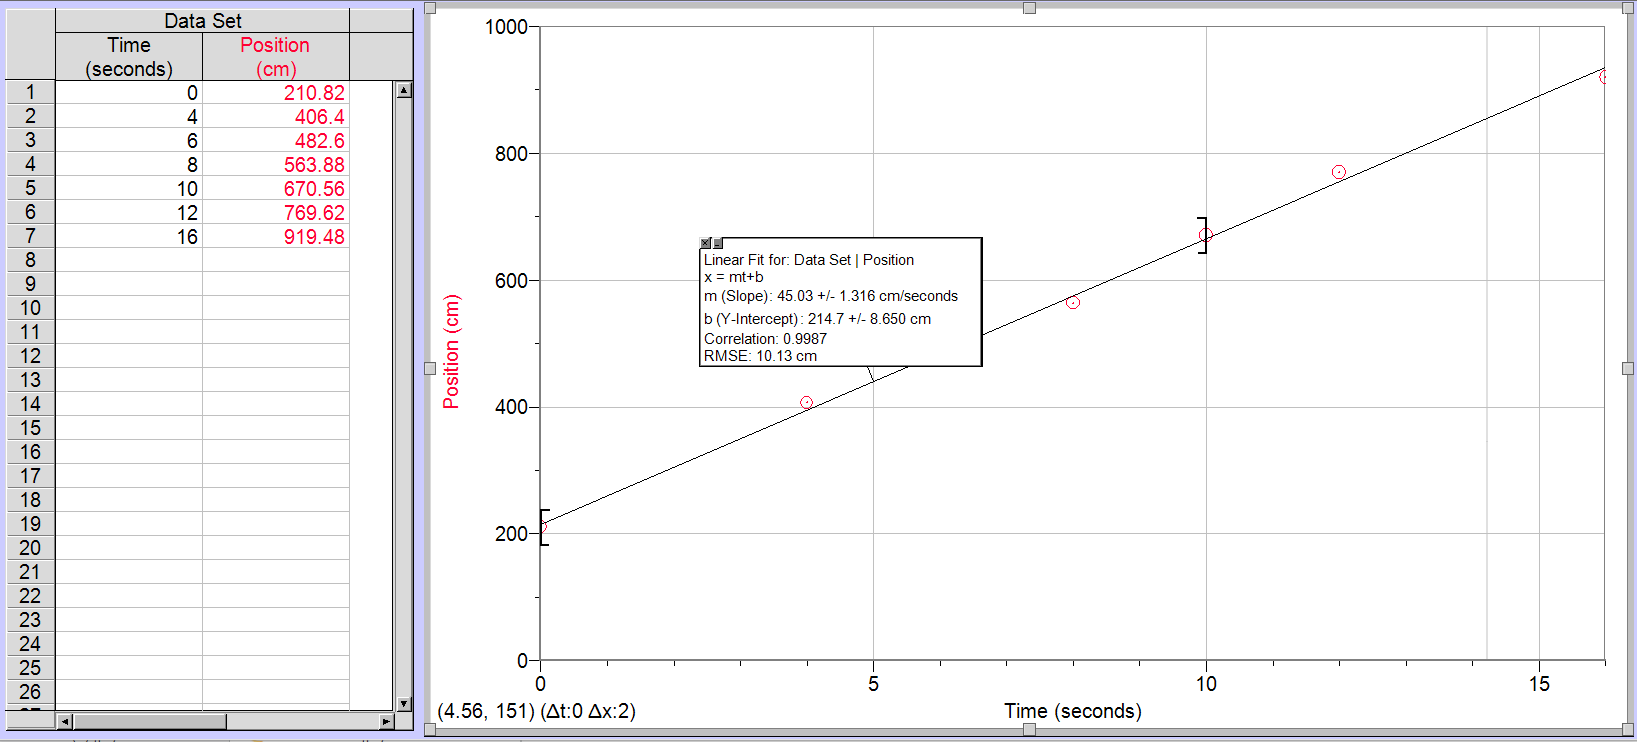
Above is, in order, diagram, raw data as recorded, and processed and presented data of initial position of 0 and 210.82 cm, respectively
A definition of the problem and selection of variables:
How does time affect the position of a buggy? The independent variable is time and the dependent variable is position.
The controlling variables:
Same initial position of buggy (unless otherwise instructed to change it), same course or track, speed of buggy for each trial, same vehicle. Using the same vehicle allowed for same mass and speed across all trials and we kept the buggy on the same course for the whole time, stopping it with our feet to restart if it changed directions.
A developed method for the collection of data:
The buggy drives between 2 and 16 seconds, and trials were taken in increments of 2 seconds (with one exception). This gave us a large range of data, and the opportunity for many data points on change in position. This was all written in One-Note in a table of time vs position. There were no repeated trials. The data was recorded in inches. It was converted using the formula...
Position (in)*2.54cm/1in
This certainly may be a cause for error since we did not take measurements using the correct units
The procedure:
The buggy is released on the count of three behind a post-it note, ensuring the release coincides exactly when another person starts a stopwatch. This also ensures that there is the same initial position for every trial. There were 8 trials from an initial position of 0 and 6 from 83 inches. Once the buggy approached the allotted amount of time, the timer would call out “stop” and the releaser placed their foot in front of the buggy, marking its final position. The measurer stacked the meter sticks in front of each other starting from the post-it note until reaching the releaser’s foot
Use your evidence to draw conclusions that address the purpose of the lab:
As time increases, position also increases. The steepness of the slope of the data is constant, meaning that there is a direct relationship. This direct relationship means Xf= m*deltat + Xi can be used since this is a linear relationship. This means that, for a typical car on the highway at a constant speed, as time increases, the position of the car also increases up the highway.
Conclusion:
The slope of the graph with an initial position of zero is 41.94 cm/s plus or minus .7033 cm/s. This means that for every second the buggy is in motion, its position increases by 41.94 centimeters given a margin of error of about .7033 cm/s in both a positive and negative direction. The slope was slightly different when starting at 210.82 centimeters at 45.03 cm/s. The slope indicates the speed with which the buggy was moving. However, the same buggy was used for all the trials at a constant speed, indicating an error in the data. The y intercept represents the initial position of the buggy. However, the error in the linear regression is that it merely serves to create the most accurate prediction of data not collected. Thus, the y-intercepts will not be entirely accurate as they are only predictions. The real data points where time is 0 is the initial position of the buggy. Another way this data could be applied is to planes. If two planes are travelling parallel at a constant speed, meaning their position-time graphs have the same slope, for a given amount of time, they will remain parallel when wind is held constant because their positions will increase by the same amount. The two biggest sources of uncertainty stem from the lack of data points and range of data. Around 10 data points is very much a bare minimum, and more data could provide more precision in our calculations. 0-16 seconds is also not a great deal of time. While we were under the time constraint of class, a larger range of time could yield more data over a larger frame, giving a greater, more accurate picture of a position-time relationship. This means that in order to improve, the buggy could travel for longer recorded periods, and this would efficiently yield more data as well. Another source of error was that we started from the back wheels, displaying additional distance travelled that was the length of the buggy.
